Pages

Showing posts with label Support. Show all posts

Thursday, 15 February 2018

VIX Index Indicator (Fear Index)

VIX Index is one of the popular index that measure the global stock market's expectation of volatility implied by the S&P 500 and it is also known as "Fear Index". Investors should constantly check the VIX Index as it shows the fear of public investors on the global stock markets.

So, How do we know whether the public investors are panic and fear on the global stock markets? Let's backtesting the past few economic crisis results,

In 2008 (The worst economic disaster since Great Depression of 1929)

VIX Index in 2008
VIX Index in 2008

The economical crisis was started around the end of 2007 till 2009. The VIX index above showed how panic the public investors are and compared it with the stock market in 2008. The VIX index has almost reached 100% in such a short period.
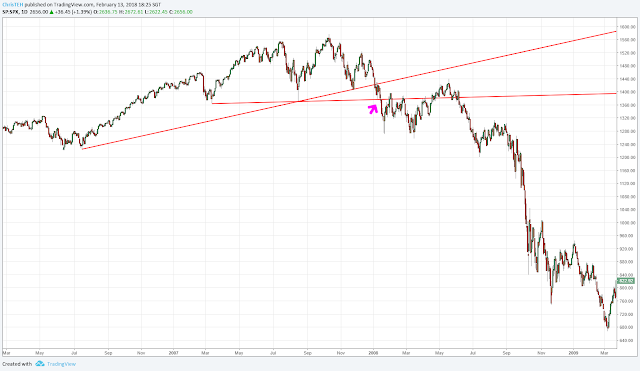
S&P 500 in 2008
S&P 500 in 2008

Usually, when the S&P 500 has fall below the important support lines then we would see a high pitch of VIX index. In other words, global investors are selling off their stocks and start to fear about the future. Or else, the movement of VIX index would be at around 20%.

In 2015 (Latest correction of global stock market)

As we mentioned earlier, if the stock markets went too high without any correction then be prepared for it as it will eventually comes. Please do not mistaken the difference between technical correction and economic crisis.

S&P 500 in 2015
S&P 500 in 2015

Since after the economic crisis in 2008, the S&P 500 went uptrend for around 220% without any proper deep correction. In August of 2015, the S&P 500 index has finally make a correction for more than 15% in just a period of 6 months.

VIX Index 2015
VIX Index in 2015

Before the stock market collapse, VIX index will always went higher than before because of majority of the investors are fear and uncomfortable with the current markets price. Basically, VIX index (Fear Index) will always be unstable when most of the investors are greed and the global stock index price went up until uncontrollable.

To be advised:
1) Always check the VIX index to see how fear is the global investors at this current stock markets.
2) VIX went higher than normal means that the stock markets are going to have a correction or collapse.

Hope everyone could understand the VIX index. Please drop any comments. Thanks.


Saturday, 10 February 2018

Global Stock Market is Falling or Correction?

These days everyone is concerned about the future movement of the Global Stock Market. Recently, the global markets were influenced by the US NASX and S&P 500 markets. Many people were arguing whether is it a new crash (after 10 years) or just a correction.

To be honest, all fundamental analysis are pointless at this current global markets condition, investors should focus more on the technical analysis to determine where to take profit or stop loss. The Index PE ratio has actually dropped back to last year level. However, we believe that it is only a technical correction as the S&P 500 were on the uptrend without any correction since early of 2016 for around 60%.

S&P 500 Global Stock Market Correction
Around 60% uptrends since early of 2016 

Investors should focus more on the US Stock Market (S&P 500) as the global market falling due to them. Most importantly, this is not yet a global economic crisis because there are no economic crashes at this moment (Unsimilar to the past few global crisis). All the annual company financial reports released lately reflects that the economic are still strong and solid.

However, we would still need to prepare for any possibilities. According to the technically analysis, there are a few supports that need to be considered. If the US index fall below the support, we will have to start preparing for the second stock portfolio adjustment.

S&P 500 Support line for Global Stock Market
S&P 500 First Support @ 2540.00

The first support would be at 2540.00 and the second is at around 2467.73. If it is really fall below the second support, we believed that the bear market might just gonna start. Hence, from now onwards, the global stock markets are getting more harder to invest for normal investors.

To be advised,
1) Please sell off without hesitate for those short term stocks that did not perform too well.
2) For medium or long term investors should wait for a better signal.
3) US government still planning to increase the interest rate on the upcoming FOMC meeting. hence, the global stock markets have not really come to the end yet.
4) If it is just a correction of the global stock market, we should start looking for any undervalued stocks to increase your stock management portfolio.

Please feel free to drop any comments. Thanks.


Wednesday, 3 May 2017

Upcoming Malaysia Market Trend

Alibaba's (Jack Ma) is planning to invest a huge amount of money into Malaysia as everyone knows. Which means that Malaysia technology stocks would be taking a huge advantages as he would either acquired or work together with the local technology company in order to build up his e-commerce market.

As this so called "Investment" by Jack Ma has not been confirmed between the government and him. But some of the stocks have already overrated on the news and his visits to Malaysia. For instance, XINHWA, 5267 and GHLSYS, 0021.

XINHWA, 5267. Recently, they have build up an ecommerce website (e5buy.com) which have actually attracted china investors.


When the news released, the stocks shoot up straight. 

GHLSYS, 0021. They have already signed an agreement with Alibaba on Alipay in Malaysia. Which means, the future of this stock could be highly considered.

A high volume and a gap after the news released
 For TA, we could consider looking at the support line. Once it hit the support line without further dropping, we could target the price to about 1.78.

According to Public bank research, there are also 7 more technology companies that we all should be aware. For instance, (PUC, 0007), (MTOUCHE, 0092), (KGROUP, 0036), (XOX, 0165), (NETX, 0020), (M3TECH, 0017) and (MNC, 0103). Besides, other than Technology stocks, CIMB and Maybank have also signed an agreement with Alibaba on the Alipay mobile wallet. In which, it may lead to another higher breakout.

Investment Tips: Always remember to set a Stop-loss for every investment.

Monday, 24 April 2017

Support And Resistance in Stock Market!! So Easy!!

When it comes to stock investment, there are many different books with different perspectives in the world. Most people doesn't really care and only know "Buy Low and Sell High". Who doesn't know? But in fact, how should we achieve it?

I have been studying about stock investment all around the world by many different authors (Obviously, i am still reading now) and i am going to give you all a simple Tips which i have concluded in most books.

Instead of "Buy Low and Sell High", we should "Buy Support and Sell Resistance". The most easiest way to trade in the stock market is to always find the Support of each stock as well as the resistance. However, we need to first identify the trend.

1) What is Support?  It is a level on the chart where buying interest is stronger than selling pressure.

2) What is Resistance? It is a level where selling pressure overcome the buying interest in the market.

KLCI Trend by Trading View

The Red Color line is the Support whereas the Green Color Line is the Resistance. The support line will be formed when the stock movement together with volume could not break through. Then a BUY signal appear. In the same, when the stock movement and volume cannot break through the Resistance Line, SELL signal appear.

For some investors, they will try to put a Buy signal on 28/12/2016 at 1630.3 (Support) and Sell Signal on 20/02/2017 at 1712.58 (Resistance). A beautiful profit could be make within 3 months.

In conclusion, earning in the stock market is not gambling. We should put more effort on doing some Technical Analysis or research, that's how we use money to earn money. Please remember, must always need to find the support and resistance together with a very high volume in order to gain the profit.